
Note
Go to the end to download the full example code.
Rotated Geometry#
Rotation of a block model geometry is a common operation in geoscience applications. By rotating the geometry, we can align it with geological features. Rotation is typically specified in degrees from the cardinal orthonormal axes (x, y, z).
import pyvista as pv
from parq_blockmodel import RegularGeometry
from parq_blockmodel.utils import angles_to_axes

# sphinx_gallery_thumbnail_number = -1
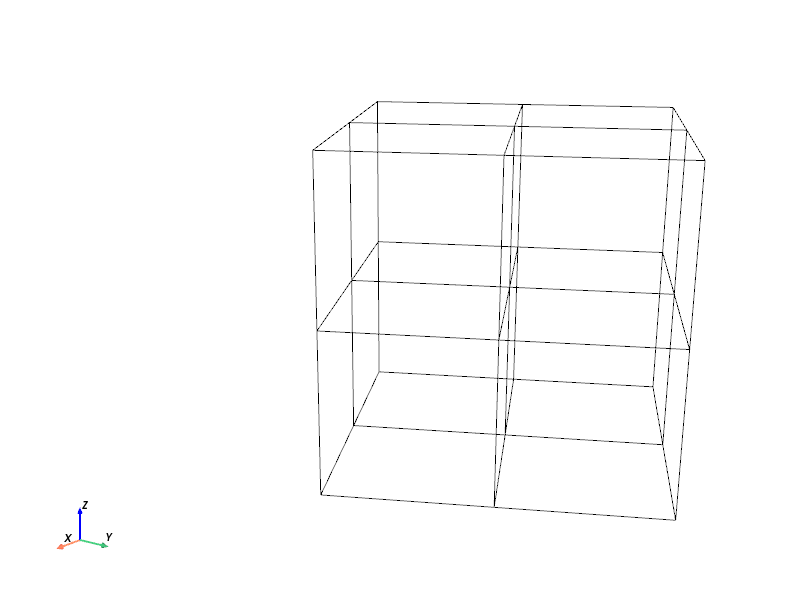
Create Two Geometries: Unrotated and Rotated#
We first create an unrotated geometry, then rotate the world axes by 30 degrees.
geom_unrotated = RegularGeometry(
corner=(0.0, 0.0, 0.0),
block_size=(1.0, 1.0, 1.0),
shape=(2, 2, 2),
)
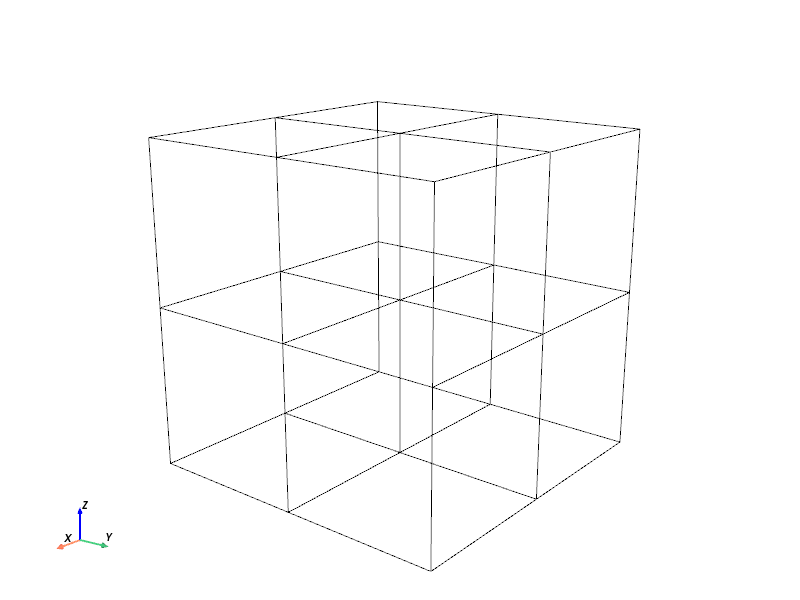
axis_u, axis_v, axis_w = angles_to_axes(axis_azimuth=30, axis_dip=0, axis_plunge=0)
geom_rotated = RegularGeometry(
corner=(0.0, 0.0, 0.0),
block_size=(1.0, 1.0, 1.0),
shape=(2, 2, 2),
axis_u=axis_u,
axis_v=axis_v,
axis_w=axis_w,
)
Visualise Unrotated then Rotated in 3D
isometric_view = [(6, 5, 3),  # camera position
                  (1, 1, 1),  # focal point (center of the grid)
                  (0, 0, 1),  # view up direction
                  ]

plotter = pv.Plotter()
edges = geom_unrotated.to_pyvista().extract_all_edges()
plotter.add_mesh(edges, color="black", line_width=1)
plotter.show_axes()
plotter.camera_position = isometric_view
plotter.show(title="Unrotated Regular Geometry", window_size=(800, 600))

plotter = pv.Plotter()
edges = geom_rotated.to_pyvista().extract_all_edges()
plotter.add_mesh(edges, color="black", line_width=1)
plotter.show_axes()
plotter.camera_position = isometric_view
plotter.show(title="Rotated Regular Geometry (World Frame)", window_size=(800, 600))

# Optional: local frame plot (axis-aligned, no rotation)
plotter = pv.Plotter()
edges = geom_rotated.to_pyvista(frame="local").extract_all_edges()
plotter.add_mesh(edges, color="black", line_width=1)
plotter.show_axes()
plotter.camera_position = isometric_view
plotter.show(title="Rotated Geometry in Local Frame", window_size=(800, 600))
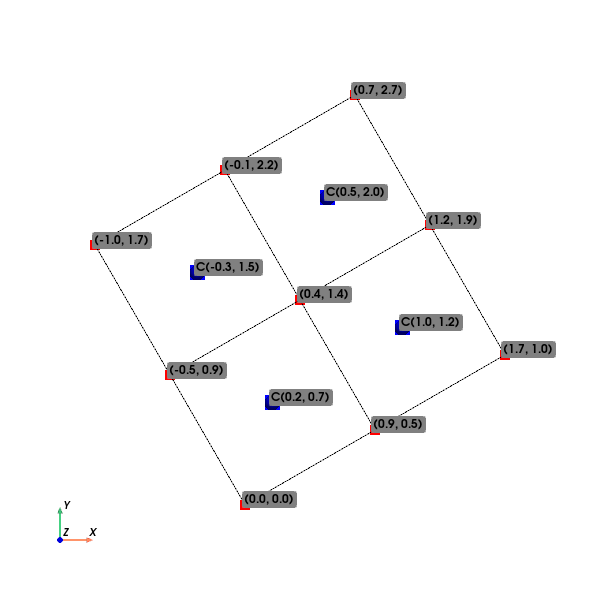
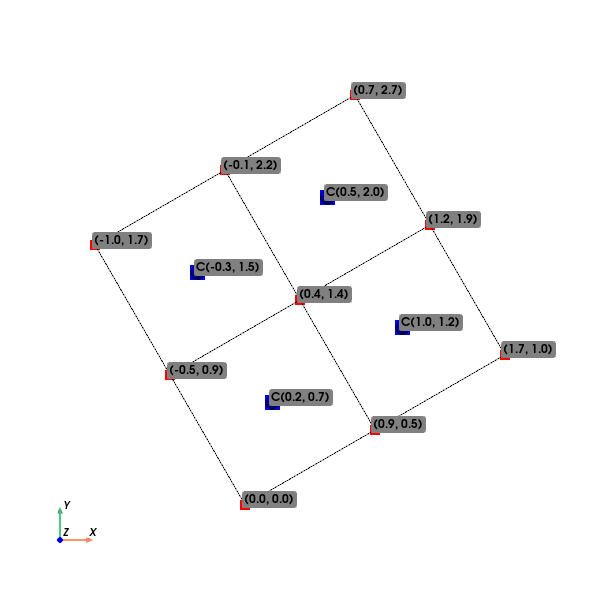
Visualise in 2D Slice at z=0.5 to intersect the first layer of cells
slice_2d = geom_rotated.to_pyvista().slice(normal='z', origin=(0, 0, 0.5))
edges_2d = slice_2d.extract_all_edges()
points = edges_2d.points
labels = [f"({x:.1f}, {y:.1f})" for x, y, _ in points]
centroids_mesh = slice_2d.cell_centers()
centroids = centroids_mesh.points
labels_centroids_2d = [f"C({x:.1f}, {y:.1f})" for x, y, _ in centroids]
plotter = pv.Plotter()
plotter.add_mesh(edges_2d, color="black", show_edges=True)
plotter.add_point_labels(points, labels, font_size=12, point_color="red", point_size=10)
plotter.add_points(centroids, color="blue", point_size=15, render_points_as_spheres=True)
plotter.add_point_labels(centroids,
                         labels_centroids_2d,
                         font_size=12,
                         point_color="blue",
                         point_size=0,  # Hide label points
                         always_visible=True,
                         render_points_as_spheres=False)
plotter.show_axes()
plotter.view_xy()
plotter.show(title="2D Slice with Corner and Centroid Coordinates", window_size=(600, 600))
Total running time of the script: (0 minutes 0.492 seconds)