Note
Click here to download the full example code
Constraints and Status
This example demonstrates how constraints relate to the status property.
It is common for there to exists upper bounds for some analytes, driven by the mineralogical composition. For example a sample that is expected to be Hematite (Fe2O3) will have a maximum Fe composition of 69.97%. Setting constraints on the MassComposition object provides assurance that all records in the dataset are within the specified bounds.
Cases where data is Out of Range (OOR) of the prescribed constraints will result in logged warnings. Where possible, visualisations will also highlight a status that is not OK (OOR).
import logging

import pandas as pd
from matplotlib import pyplot as plt

from elphick.mass_composition import MassComposition
from elphick.mass_composition.flowsheet import Flowsheet
from elphick.mass_composition.datasets.sample_data import sample_data

logging.basicConfig(level=logging.INFO,
                    format='%(asctime)s %(levelname)s %(module)s: %(message)s',
                    datefmt='%Y-%m-%dT%H:%M:%S%z')

# sphinx_gallery_thumbnail_number = -1
Create a MassComposition object
We get some demo data in the form of a pandas DataFrame
df_data: pd.DataFrame = sample_data()
df_data
Construct a MassComposition object
obj_mc: MassComposition = MassComposition(df_data)
Inspect the default constraints and the status
obj_mc.constraints
{'mass_wet': [0.0, inf], 'mass_dry': [0.0, inf], 'H2O': [0.0, 100.0], 'Fe': [0.0, 100.0], 'SiO2': [0.0, 100.0], 'Al2O3': [0.0, 100.0], 'LOI': [0.0, 100.0]}
print(obj_mc.status)
status.ok: True
num_oor: 0
The status is ok since the data is all in range, so there are no OOR records.
Modify the constraints to demonstrate OOR data
The Fe upper constraint will be set low enough to demonstrate the OOR case.
obj_mc_oor: MassComposition = MassComposition(df_data, constraints={'Fe': [0.0, 60.0]})
print(obj_mc_oor.status)
2024-05-28T13:06:29+0000 WARNING mc_status: 1 out of range records exist.
status.ok: False
num_oor: 1
We can view the failing records
obj_mc_oor.status.oor
OOR data within a network
When an object exists in a network with a failing status (with OOR data) it will be coloured red.
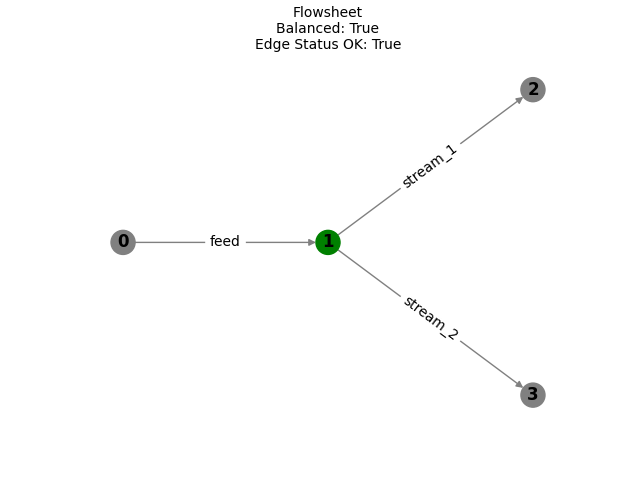
We will first construct a simple network and plot it, the network is balanced (across nodes)
obj_mc_feed: MassComposition = MassComposition(df_data, name='feed', constraints={'Fe': [0.0, 69.97]})
obj_mc_1, obj_mc_2 = obj_mc_feed.split(0.4, name_1='stream_1', name_2='stream_2')
fs: Flowsheet = Flowsheet().from_streams([obj_mc_feed, obj_mc_1, obj_mc_2])
fs.plot()
plt.show()
print(fs.balanced)

True
Now we will modify the grades of a single stream so that they are OOR. Note that this will also create a node imbalance that is highlighted red.
obj_mc_2.update_data(obj_mc_2.data['Fe'] + 10.0)
obj_mc_2.data.to_dataframe()
fs.plot()
plt.show()
print(fs.balanced)
![Flowsheet Balanced: False Edge Status OK: False, {'stream_2': ['Fe']}](../_images/sphx_glr_111_constraints_and_status_002.png)
2024-05-28T13:06:29+0000 WARNING mc_status: 1 out of range records exist.
2024-05-28T13:06:29+0000 WARNING mc_status: 1 out of range records exist.
2024-05-28T13:06:29+0000 WARNING mc_status: 1 out of range records exist.
2024-05-28T13:06:29+0000 WARNING mc_status: 1 out of range records exist.
2024-05-28T13:06:29+0000 WARNING mc_status: 1 out of range records exist.
2024-05-28T13:06:29+0000 WARNING mc_status: 1 out of range records exist.
2024-05-28T13:06:29+0000 WARNING mc_status: 1 out of range records exist.
False
Display the offending edge records
print(fs.get_edge_by_name('stream_2').status.failing_components)
fs.get_edge_by_name('stream_2').status.oor
['Fe']
The red edge is caused by the Fe of 71.0 on stream_2 exceeding 69.97.
The red node is caused by the mass not balancing across that node - we would expect the imbalance to be in Fe.
fs.graph.nodes[1]['mc'].node_balance()
We have confirmed the imbalance is in Fe by inspecting the balance across node 1.
The interactive network plot applies equivalent formatting.
fig = fs.plot_network()
fig
2024-05-28T13:06:29+0000 WARNING mc_status: 1 out of range records exist.
2024-05-28T13:06:29+0000 WARNING mc_status: 1 out of range records exist.
2024-05-28T13:06:29+0000 WARNING mc_status: 1 out of range records exist.
2024-05-28T13:06:29+0000 WARNING mc_status: 1 out of range records exist.
2024-05-28T13:06:29+0000 WARNING mc_status: 1 out of range records exist.
2024-05-28T13:06:29+0000 WARNING mc_status: 1 out of range records exist.
2024-05-28T13:06:29+0000 WARNING mc_status: 1 out of range records exist.
2024-05-28T13:06:29+0000 WARNING mc_status: 1 out of range records exist.
Total running time of the script: ( 0 minutes 0.577 seconds)