Note
Go to the end to download the full example code.
Flowsheet from File
It is possible to create a Flowsheet object from a file. This example demonstrates how to create a Flowsheet object from a file.
import inspect
from pathlib import Path

import pandas as pd
from matplotlib import pyplot as plt

from elphick.geomet.flowsheet import Flowsheet
from elphick.geomet.flowsheet.stream import Stream
from elphick.geomet.utils.data import sample_data

__file__ = Path(inspect.getfile(inspect.currentframe())).resolve()
YAML file
The yaml file needs to follow this structure.
yaml_filepath: Path = Path(__file__).parents[2] / 'elphick/geomet/config/flowsheet_example_simple.yaml'
yaml_config: str = yaml_filepath.read_text()
yaml_config
'FLOWSHEET:\n flowsheet:\n name: Flowsheet\n streams: # graph edges\n Feed:\n name: Feed\n node_in: feed\n node_out: screen\n Coarse:\n name: Coarse\n node_in: screen\n node_out: lump\n Fine:\n name: Fine\n node_in: screen\n node_out: fines\n operations: # graph nodes\n feed:\n name: feed\n screen:\n name: screen\n lump:\n name: lump\n fines:\n name: fines\n'
Create Flowsheet
fs: Flowsheet = Flowsheet.from_yaml(yaml_filepath)
fs
<elphick.geomet.flowsheet.flowsheet.Flowsheet object at 0x7f36e710a9c0>
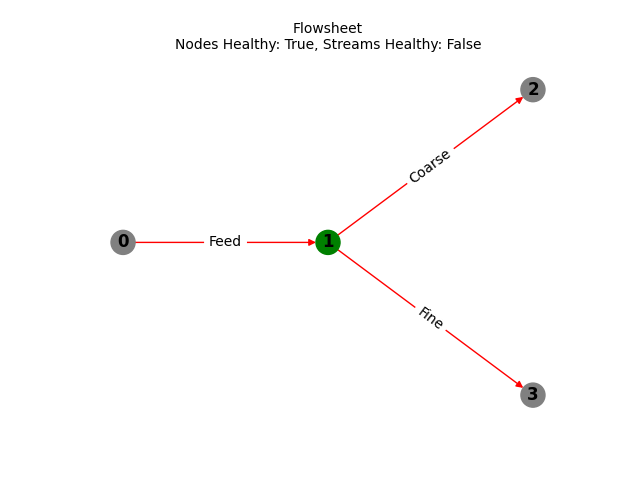
The Flowsheet object can be visualized as a network. The streams are not yet populated, so are shown in red.
fs.plot()
plt
<module 'matplotlib.pyplot' from '/home/runner/work/geometallurgy/geometallurgy/.venv/lib/python3.12/site-packages/matplotlib/pyplot.py'>
Load the data
Load data onto two of the three streams.
df_feed: pd.DataFrame = sample_data()
obj_feed: Stream = Stream(df_feed, name='Feed')
# assume the Coarse stream is 0.4 of the Feed stream mass
df_coarse: pd.DataFrame = df_feed.copy()
df_coarse['wet_mass'] = df_coarse['wet_mass'] * 0.4
df_coarse['mass_dry'] = df_coarse['mass_dry'] * 0.4
obj_coarse: Stream = Stream(df_coarse, name='Coarse')
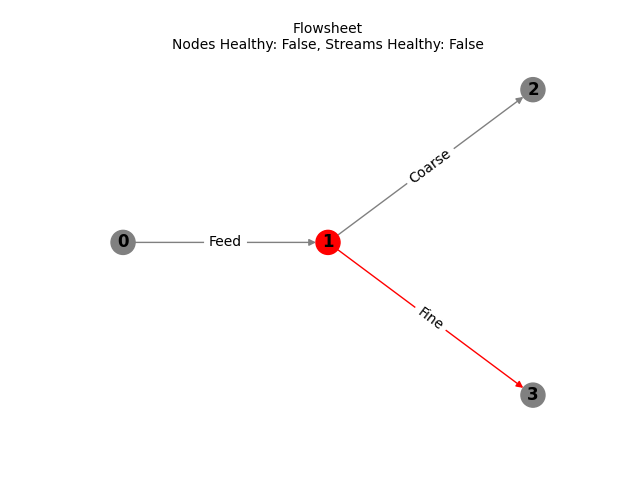
fs.set_stream_data(stream_data={'Feed': obj_feed, 'Coarse': obj_coarse})
fs.plot()
plt
<module 'matplotlib.pyplot' from '/home/runner/work/geometallurgy/geometallurgy/.venv/lib/python3.12/site-packages/matplotlib/pyplot.py'>
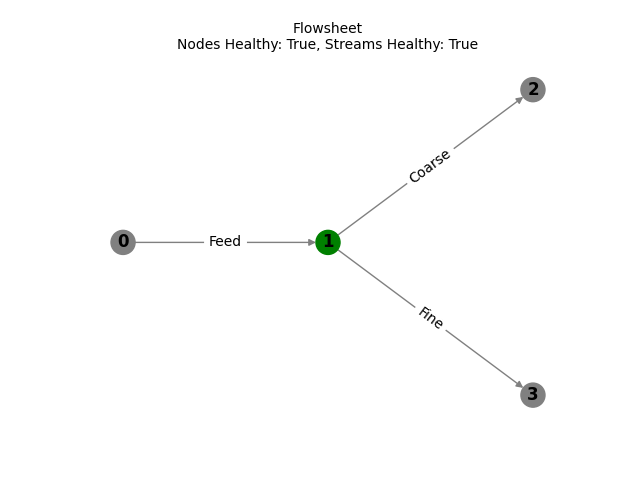
Solve the flowsheet
fs.solve()
fs.plot()
plt
<module 'matplotlib.pyplot' from '/home/runner/work/geometallurgy/geometallurgy/.venv/lib/python3.12/site-packages/matplotlib/pyplot.py'>
Plot the mass balance
fig = fs.table_plot(plot_type='network')
fig
Total running time of the script: (0 minutes 1.091 seconds)